Telemetry Timeframes
· John Nunemaker · 1 min read
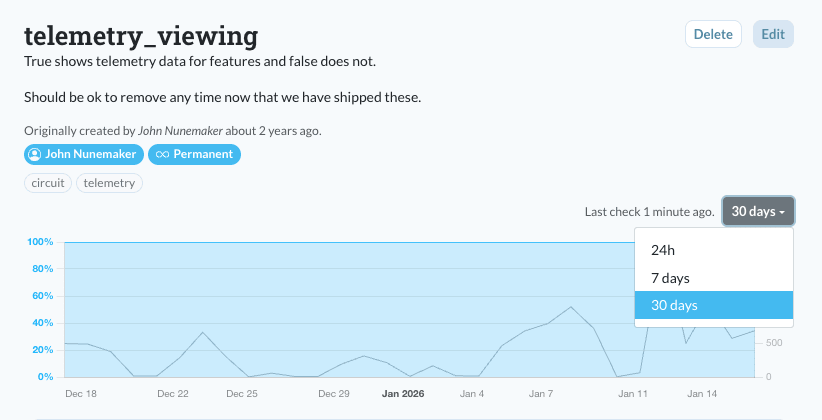
Up until now we've only shown 24 hours of telemetry data even though we've been storing more history. 24 hours was great because that's usually enough to know if a flag is fully removed from the code and ready to be deleted. But sometimes you need a longer time frame, especially in lower traffic applications.
Now, based on your plan, you'll be able to see longer time ranges (up to 90 days) of the enabled % for a feature and how many times it was checked in production. Check out our pricing for analytics retention details by plan.
You might also notice that we improved the graph recently. Previously, you had to do a lot of math yourself to figure out the enabled %, but now you can quickly see enabled % on the left axis and total number of feature checks on the right.
Get audit history, rollbacks, advanced permissions, analytics, and all of your projects in one place.
You can choose from several tiers to sponsor Flipper on GitHub and get some great benefits!